 Download slides
Truckload shipping outlook: storms, rates, and capacity

On this page
U.S. spot market
The first half of hurricane season has been very mild, as far as impact to the freight market goes. September is historically the peak month for hurricanes, followed by October. With storms still on the horizon, shippers should have a plan to navigate impacts to their supply chain that can occur even if their operations aren’t directly hit.
To aid in that planning, it’s important to understand the three distinct phases of freight flow disruption: before, during, and after the event.
Before the storm
Shippers rush to clear docks and forward-position freight, while carriers avoid moving standard loads into the at-risk area. Trucks and vessels look to reposition out of the storm’s path, creating a temporary tightening of regional capacity and often a short-term spike in rates. Incoming ocean cargo may be diverted to alternate ports, which can lead to temporary congestion.
During the storm
Safety becomes the overriding concern. Freight movement is minimal and largely restricted to emergency and relief efforts, with government agencies typically determining when activity can safely resume.
After the storm
Freight patterns depend on the scale of the damage and the economic importance of the region hit. Recovery usually begins with dry van and reefer shipments of essential goods, followed by flatbed shipments of equipment and construction materials. Inbound rates surge quickly due to the urgency of supplies, while reopening shippers often face order backlogs that drive outbound demand.
This can attract for-hire carriers into the region, tightening truck availability in other parts of the country. For ocean and rail shipments, diversions to alternate ports or terminals generally continue until the affected facilities are restored to full operations.
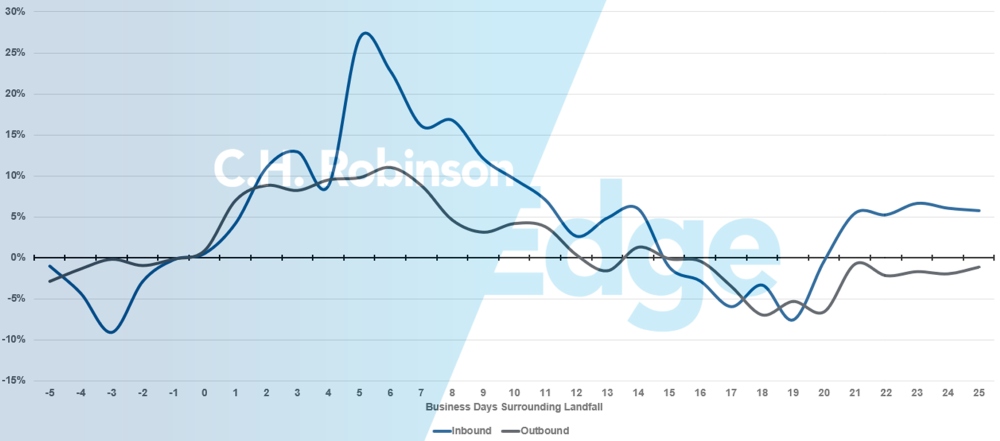
The impact on local freight volume and cost is evident when visualizing the data from over half a dozen major hurricanes:
Average hurricane impact to local volume
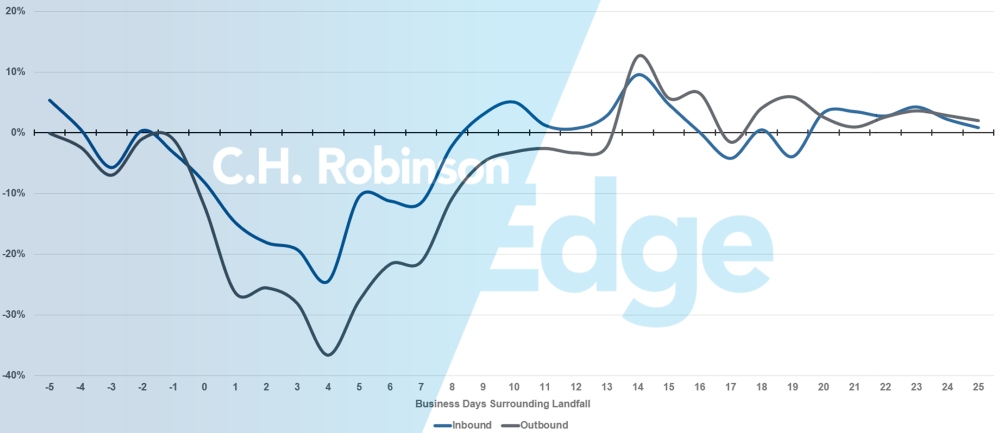
Average hurricane impact to local cost/mile
Read about staying prepared during hurricane season, get our utility playbook for emergency events, or contact your C.H. Robinson account team for help with planning.
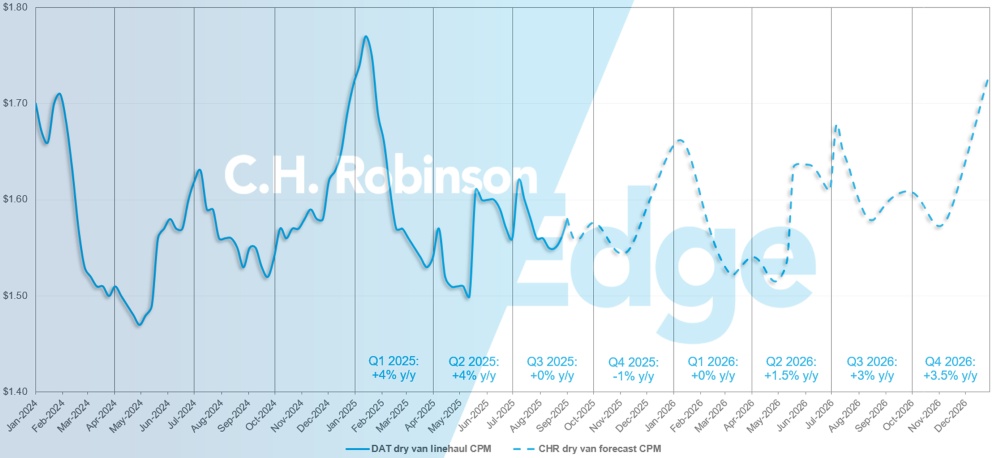
U.S. spot market forecast: Dry van truckload
The C.H. Robinson 2025 dry van cost-per-mile forecast remains at +2% y/y.
Due to lower levels of consumer spending, which is the largest driver of the U.S. economy and also U.S. freight volumes, combined with a continued increase in carrier operating costs, 2026 is expected to have a modest increase in spot rates. The C.H. Robinson 2026 dry van cost-per-mile forecast announced in the August C.H. Robinson Edge Report remains at +2% y/y.
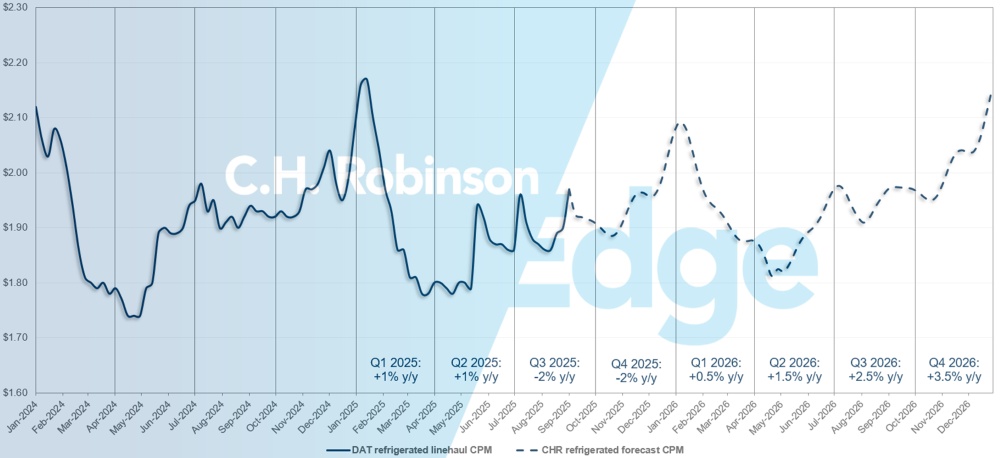
U.S. spot market forecast: Refrigerated truckload
The C.H. Robinson 2025 refrigerated van cost-per-mile forecast remains at -1% y/y, while the 2026 forecast remains at +2% y/y.
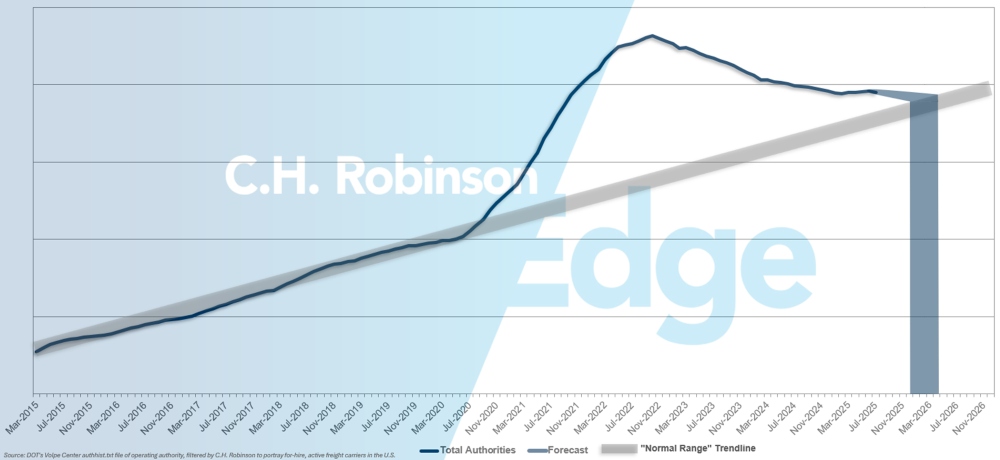
For-hire carrier forecast
The U.S. trucking market remains in an elongated state of carrier oversupply, keeping trucking capacity for shippers plentiful. If the current pace of carriers leaving the market continues, C.H. Robinson’s projections indicate a return to historical norms by early 2026.
Contract truckload environment
The following insights are derived from C.H. Robinson Managed Solutions™, which serves a large portfolio of customers across diverse industries.
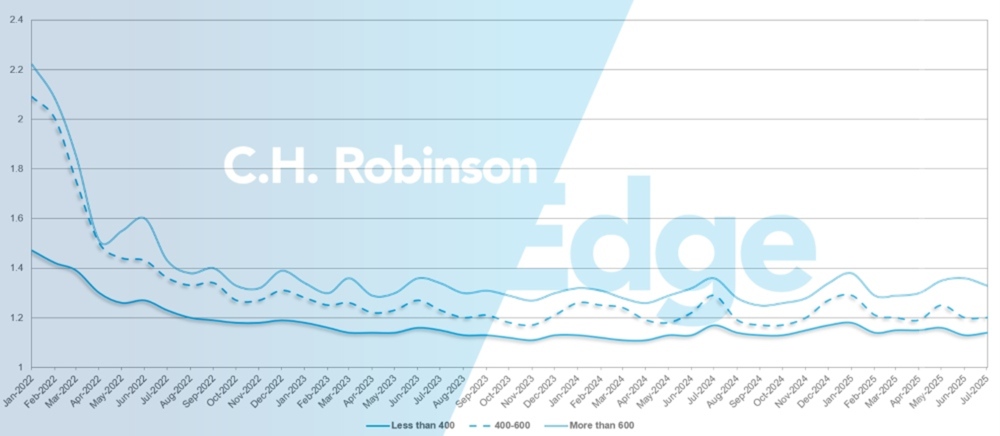
Route guide depth is an indicator of how far a shipper needs to go into their backup strategies when awarded transportation providers reject a tender. 1 would be perfect performance and 2 would be extremely poor. As displayed in the following chart, it has remained flat at a historically low level for approximately three years.
For the month of July, route guide depth across all U.S. regions and shipments was 1.2, a slight improvement compared to the previous month of 1.21.
From a mileage perspective, long hauls of more than 600 miles had a route guide depth of 1.33 in July—better than the 1.35 the previous month and the 1.35 in July 2024.
For shorter hauls of less than 400 miles, route guide depth for July 2025 was 1.14, which is slightly worse than the previous month of 1.13 but better than July 2024 at 1.16.
North America route guide depth: By length of haul
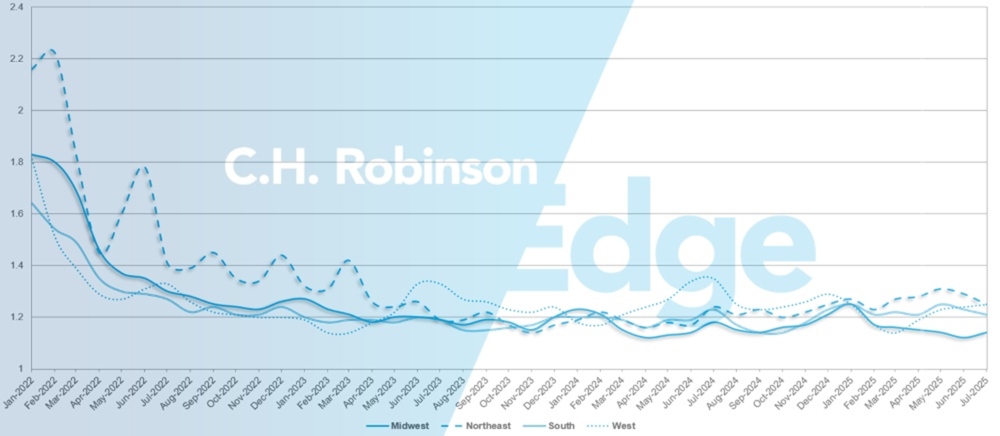
Geographically, the West experienced the smallest change of all regions, worsening by 1% from the previous month, while the Northeast experienced the largest change, improving by 3.3%. Route guide depth still remains at low levels between 1.14 and 1.25 for all U.S. regions.
U.S. route guide depth: By region
Hurricanes and contractual truckload service disruptions
When hurricanes strike, route guides often break down as awarded carriers reject tenders to avoid storm-affected areas. Even carriers willing to cover contracted loads may struggle to do so, or struggle to meet agreed-upon service levels due to equipment repositioning, local access restrictions, or short-term surges in outbound freight. In these moments, shippers experience firsthand the limits of contractual pricing and coverage commitments. They’re left to lean on the spot market at higher rates.
MIT research, sponsored by C.H. Robinson, shows that route guide resiliency is strongly tied to lane volume and shipment frequency. Low-volume lanes proved most fragile in nearly every event studied, while high-volume lanes generally held up better and were influenced more by broader market conditions than by the storm itself.
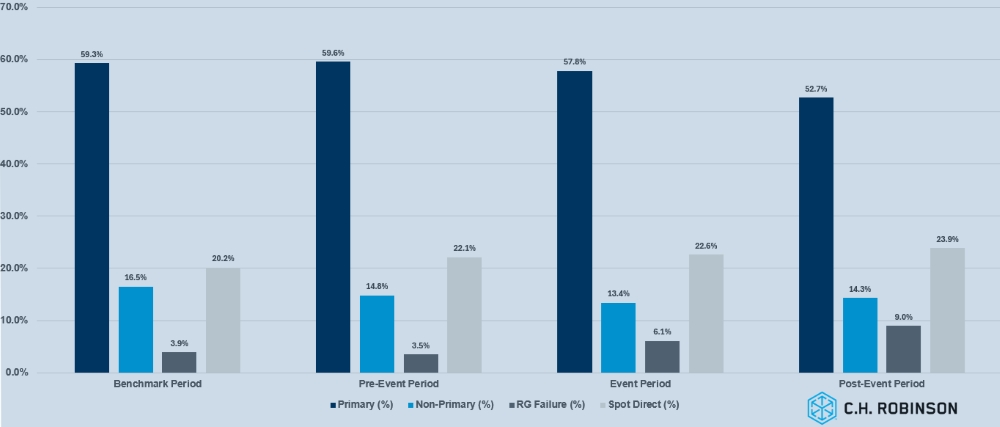
The chart below illustrates how national, high-volume contract freight was allocated before, during, and after Hurricane Harvey in 2017. The data highlights a shift away from primary carriers and toward the spot market as the disruption unfolded, with a noticeable increase in route guide failures and direct spot market activity during and after the event.
Hurricane Harvey impact on high volume contractual truckload freight
The results also reveal a difference between national and regional route guide performance. National high-volume lanes tended to show more stability, even during disruptive events, as carriers prioritized protecting anchor relationships and large-scale commitments. Regional lanes, however, were more severely affected.
In storm-impacted areas, route guides broke down more quickly as carriers diverted capacity away from risk zones or shifted toward lucrative inbound recovery freight. This imbalance highlights how geographic scope influences resiliency, with regional networks bearing the brunt of unplanned disruptions.
For shippers, the takeaway is clear: Contractual freight should not be treated as a single block of volume. Core, high-volume lanes warrant stronger agreements and close collaboration with carriers, while lower-volume and regional freight benefit from flexible strategies and contingency planning. Segmenting freight in this way helps stabilize service levels even when hurricanes place severe stress on the market.
Refrigerated truckload
East Coast United States
Freight demand out of the Northeast held steady through August. Local short-haul and New England markets tightened as seasonal shipping patterns and temperature-sensitive freight created pressure on capacity. Longer hauls to the Southeast and Texas increased as well, further pulling on regional resources. Looking ahead, September volumes are expected to rise with seasonal food and agricultural shipments. Pennsylvania-origin freight is anticipated to ramp up with fall harvest activity, contributing to outbound volume growth.
Out of the Southeast, market conditions softened as produce season came to a close, resulting in rate relief on outbound Florida and Georgia lanes. However, inbound shipments into Florida remain more costly, driven by limited freight leaving the state. Barring hurricane-related disruptions or holiday surges, conditions are expected to remain soft through the remainder of the year.
Overall, capacity across both the Northeast and Southeast is accessible with proper lead time, but same-day or late-tendered freight continues to face elevated costs. Shippers are likely to benefit from favorable outbound rates in the Southeast and should prepare for seasonal ramp-ups in the Northeast while monitoring weather-related risks in both regions.
Central United States
Pockets of tight capacity continue to emerge across the Midwest, particularly on same-day shipments, where costs remain elevated. Indiana and Michigan are experiencing tighter conditions, while Illinois and Wisconsin capacity is more readily available, though often at higher prices. South Dakota and Nebraska remain constrained by a limited pool of carriers, resulting in elevated rates. Out of Arkansas and Missouri, shipments with adequate lead time are moving well; however, same-day freight is facing capacity challenges and higher costs.
Freight out of North Texas continues to experience elevated rates, whereas shipments out of South Texas are more competitive with available capacity on standby.
Overall, standard one-pick, one-drop freight is moving smoothly. But loads destined for the Southeast consistently face elevated rates and a smaller pool of carriers, particularly those destined for Florida due to the lack of available loads returning to the Midwest.
West Coast United States
Elevated costs continue to be observed on intra-California lanes, particularly between Northern and Southern California, driven largely by seasonal shifts in produce availability. Lanes out of California remain stable, and no major disruptions are anticipated through the remainder of the summer.
With most Arizona-origin produce now tapered off, outbound volumes have declined, leaving carriers with longer wait times or increased deadhead miles. This dynamic is contributing to higher rates into Arizona, a trend expected to persist until early Q4 when the state’s produce season resumes.
The apple harvest in Washington is anticipated to ramp up in the next three to five weeks. This will likely generate rate increases out of the Pacific Northwest, while creating cost relief for inbound shipments as improved backhaul opportunities for carriers become available.
Overall, capacity remains accessible with adequate lead time. The greatest challenges arise with same-day loads or late tenders.
Flatbed truckload
Both housing starts and permits—key drivers of construction-related freight for the flatbed market—are slow, and residential freight demand is expected to remain stable but subdued through the third quarter.
U.S. single-family housing showed growth in July compared to June 2025. This growth isn’t to be celebrated just yet, as it came off of an 11-month low in June. July’s single-family housing starts reached an annualized rate of 939,000, which was 2.8% higher than the number of housing starts in June but still lower than the 949,000 in May. Elevated mortgage rates, U.S. tariffs on construction materials, and broader economic uncertainty have pressured builders to scale back projects and adjust pricing.
Flatbed market conditions have mirrored this stagnation, with overall capacity and demand holding steady for the past several weeks. The 2025 truckload rate outlook continues to project minimal year-over-year growth, signaling little change from prior expectations.
As construction season winds down, short-term demand increases are likely in northern states as projects accelerate ahead of winter weather. These localized pushes may temporarily tighten flatbed capacity, though broad market stability is expected to persist.
Attention is also turning to the peak of hurricane season, which traditionally creates a three-phase effect on freight markets. Ahead of landfall, outbound surges typically emerge as freight is repositioned, placing upward pressure on rates. During the storm, activity halts in the affected zone while emergency supplies are staged nearby.
Afterward, recovery freight drives a sharp increase in inbound demand, sometimes with a lag as damage assessments conclude and cleanup begins. In many cases, rebuilding efforts sustain inbound freight demand months after the event.
Such disruptions can create volatility in flatbed pricing and availability, particularly in the Southeast and Gulf Coast states. Planning ahead remains critical. Extended lead times and flexibility in equipment, rates, and scheduling continue to be the most effective tools for maintaining service.
Voice of the carrier
Observations from a cross-section of the contract carriers in the C.H. Robinson network:
Market
- The prolonged softness of the market is hurting carrier profitability. Some carriers have been forced to decrease the size of their fleet.
- Given market conditions, carriers are focused on balancing their existing networks.
- The transactional market is still depressed and thus an undesirable prospect for carriers.
Drivers
- The available pool of drivers remains plentiful, allowing carriers to find savings on advertising and hiring costs while maintaining strict quality standards.
- Retention levels are comfortable, with a few carriers still seeing improvements.
Equipment
- Equipment continues to be widely available.
- While trailer costs have come down, some carriers commented that truck costs have not.
 Actionable freight insights